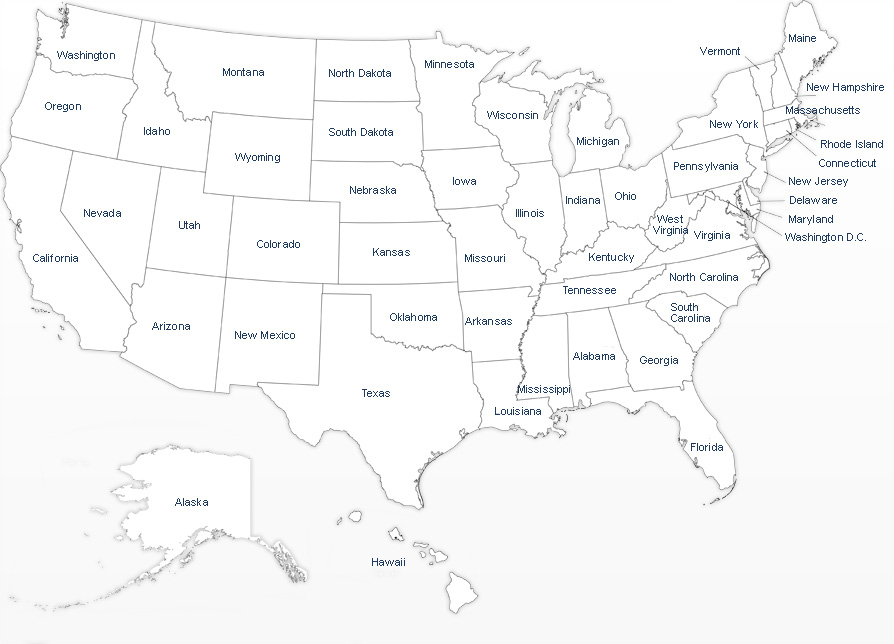
Medicaid Fraud Control Units
Statistical Data for Fiscal Year 2015

1Investigations are defined as the total number of open investigations at the end of the fiscal year.
2Recoveries are defined as the amount of money that defendants are required to pay as a result of a settlement, judgment, or prefiling settlement in criminal and civil cases and may not reflect actual collections. Recoveries may involve cases that include participation by other Federal and State agencies.
3 "Global" recoveries derive from civil settlements or judgments involving the U.S. Department of Justice and a group of State MFCUs and are facilitated by the National Association of Medicaid Fraud Control Units.
Information in this chart was reported to OIG by the 50 State MFCUs, except Total Medicaid Expenditures. MFCU Grant Expenditures and Total Medicaid Expenditures include both Federal and State shares. Abuse/Neglect cases are defined to include "patient funds" cases.
All information is current as of February 16, 2016.
Source Data: Statistical Chart FY 2015
508-compliant Data: Statistical Chart FY 2015
